Slow Postgres queries are rarely the database's fault
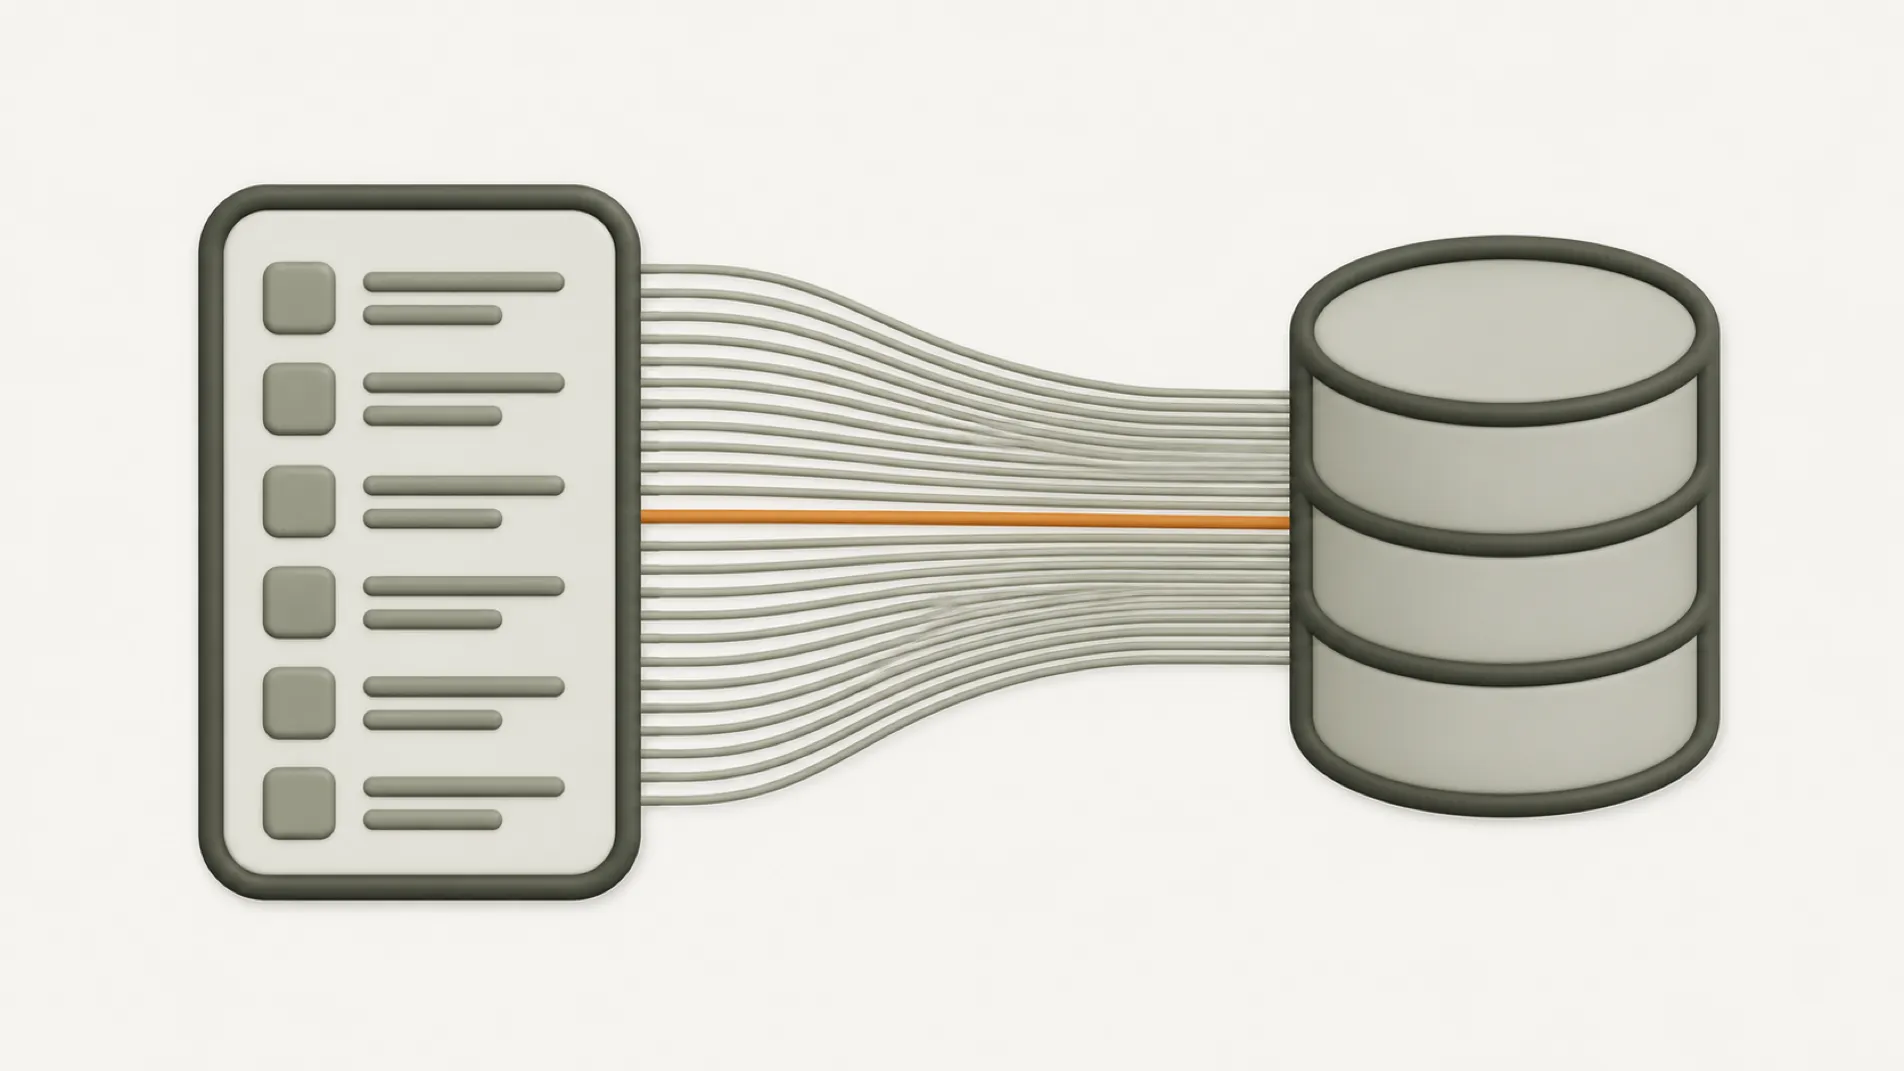
When a screen takes four seconds to load, the usual reaction is to look at the size of the server. Almost always the problem lies elsewhere: the screen runs forty-one queries where one would do, or it runs a single query that scans an entire table because an index is missing. Neither gets fixed by paying for a bigger machine.
First: measure before guessing
Before touching anything, you need to know which query is slow and how many times it runs. Without that, optimizing is shooting in the dark.
Two things, in this order:
- Slow query log. Postgres can log every query that crosses a threshold. Set the threshold low, around 200 ms, for a while and see what shows up.
- Count queries per request. Almost every framework has a way to count them. If one screen fires more than ten, that’s where the problem is. The index can wait.
That second step is the one most often skipped, and the one that most often cracks the case.
N+1, the most common case
The pattern is always the same. You ask for a list, and for each item in the list the code fetches something else:
SELECT * FROM invoices WHERE organization_id = 12;   -- 1 query, 40 rows
  -- and then, inside the loop that renders each row:
  SELECT * FROM customers WHERE id = 331;            -- 40 more queries
Forty-one queries for one screen. Each one is very fast, around half a millisecond, so none of them shows up in the slow query log. What you notice is the sum: forty-one round trips to the database, and the cost there is network latency repeated forty times over. The queries themselves are cheap.
None of the 41 queries above is slow: each takes half a millisecond. What you notice is the sum of the round trips.
Why it’s so common: ORMs hide it. invoice.customer.name looks like a property access, but it’s
a query. The code reads perfectly; the problem only shows up when you measure.
How to fix it: fetch the related data in one go, with a JOIN or with a second query that
fetches all the customers for those forty invoices. Two queries instead of forty-one. Every ORM has a
way to do it; in most it’s called eager loading.
What doesn’t fix it: putting a cache on top. The cache hides the symptom, the problem comes back as soon as the data changes, and you’ve added an invalidation problem you didn’t have before.
Indexes and why you don’t add them everywhere
The second most common case: a query that scans the whole table because there’s no index it can use. With a thousand rows you don’t notice. With two hundred thousand, you do.
The short rule: index what appears in WHERE, in JOIN and in ORDER BY, starting with the
columns that filter the most.
Three things almost nobody considers:
- Order matters in a composite index. An index on
(organization_id, date)works for filtering by organization, and also for filtering by organization and sorting by date. It doesn’t work for filtering by date alone. - Wrapping the column in a function disables the index. If you query on the result of applying a function to the column, the regular index stops being used: you need an index on that expression.
- Every index has a write cost. Every
INSERTand everyUPDATEalso updates each index on the table. Index everything and reads fly while writes crawl.
That’s why indexes go on queries that have been measured, and none go in “just in case”.
Reading the execution plan without being an expert
EXPLAIN ANALYZE in front of the query tells you what Postgres is going to do and how long it
really takes. It has a reputation for being unreadable, but for diagnosis you only need to look at
three things:
Seq Scanon a large table. It’s scanning the whole table. If it comes with a filter that discards almost everything, an index is missing.- The gap between estimated rows and actual rows. If Postgres expected 10 and found 40,000, its statistics are out of date and every decision after that is based on a wrong number. The fix is to update the table’s statistics.
Nested Loopwith many iterations. It’s usually N+1 written in SQL.
You don’t need to understand the rest of the tree. Those three signals will point you to almost every problem.
What stays slow even after all this
COUNT(*)on large tables. Counting rows means scanning them. If you only need it for pagination, an estimate or a “more results” link is almost always enough in place of the exact total.- High
OFFSET.OFFSET 10000means reading and discarding ten thousand rows. Paginate long lists by cursor and keep page numbers for short ones. LIKE '%something%'. The leading wildcard prevents the index from being used. Real text search needs a full-text search index.- Queries inside a long transaction. They look slow because they’re waiting for something else. The problem there is locking.
When this isn’t worth it
If your table has a thousand rows and will still have a thousand rows two years from now, don’t
optimize anything. A Seq Scan over a thousand rows is faster than going through the index, and Postgres
knows it: that’s why it sometimes ignores an index you’ve just created.
The practical threshold: when a table grows past a few tens of thousands of rows and shows up on a screen people use every day. Before that, the time is better spent elsewhere.
And a recommendation against the usual reflex: measure before you change technology. Most migrations to another database “because it didn’t scale” fix an N+1 along the way and credit the improvement to the new engine.
Vecinly is multi-tenant, with organization filters on every query, which is exactly where a composite index decides whether a screen takes 80 ms or 4 seconds. It’s in its case study, and how all of this gets decided in the design phase is in custom SaaS.